


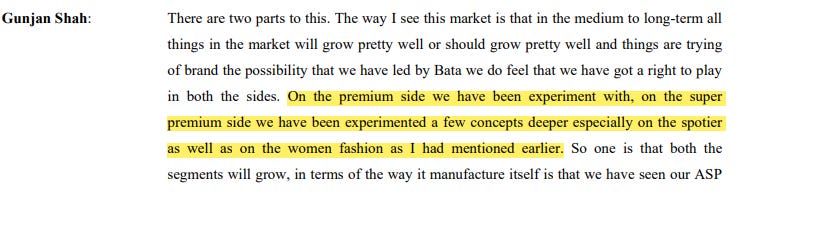
Metro Brands : Embarking on a premiumization led journey

Most of the time in the market we have heard about a term called consistent compounder. So, what is a consistent compounder and how can we spot it. No one thinks when they purchase any stock as they are buying any consistent compounder. It’s a journey of the company in several ups and downs which transform them into consistent compounders. TITAN. Astral poly, Asian Paints, APL Apollo, Page industries, Marico, HDFC Bank, BKT, Relaxo and many more. All of them have several things in common: Large TAM, Unorganised to Organised, Aspirational management, Higher reinvestment rate and power to protect their moat whether it’s in terms of economic moat or any other moat.
Recently Piyush Goyal has said that the Indian footwear industry can increase 10 times in the near future. I don't know whether he will be right or wrong but in today’s blog we’re discussing one footwear company known as Metro Brands which was established in 1955 is one of the largest footwear retailers. MBL had opened their first store in Colaba, Mumbai and today they have 672 stores across India. Many of you are thinking that why am I writing blog on this company which is already known to the street and alpha can’t be created from here due to high base of market cap, But I personally think that market cap should be not be one metric to choose any company and sometimes consensus also made money in this market. Moreover MBL tick all the boxes which I have mentioned above regarding the consistent compounder.
This blog might be long and detailed so, hold on your seats and start with my analysis of MBL.
1. Industry
- Indian consumption story and structural shift
- Will China story play out in India
- Retail sector breakdown
2. Why do I like Metro Brands over other companies?
- Short History
- Business overview
- Manufacturing, outsourcing and vendor’s engagement
- Products, geographies and store footprints
- Store/Unit Economics of Metro Brand
- Management
3. Why should you look into Add- Spend and brand ambassadors?
4. MBL VS PEERS
5. Cravatex acquisition
6. Can they replicate their past growth (Accelerator pitch)?
7. Financials and Valuation
8. Key risks
1. INDUSTRY
FOOTWEAR SECTOR OVERVIEW:
I will try to cover only the main points which will help you to better understand this industry. The Indian Footwear market is valued at INR960b as of FY20, of which, over one-third is composed of high-ASP products predominantly catered by organized/branded players growing at 1.5x the rate of overall market growth (15% CAGR over FY15-20). The market is witnessing a unique transformation over the last few years and is expected to grow at CAGR of 15-17% till FY25.
Points which will help you to find opportunity in this sector:
- India is the second largest consumer of footwear in the world after China, however still per capita consumption is only 1.9 pairs per annum against the global average of 3.2 pairs.

- Major growth will come from an organized market led by urbanization, GST and increased brand awareness. Increased share of e-retail (online) as various modern retailers adopt an increasingly multi-channel approach to reach customers across varied age and income profiles.

- Women segment is expected to grow faster than the men's segment due to the increasing number of working women, changing lifestyles.
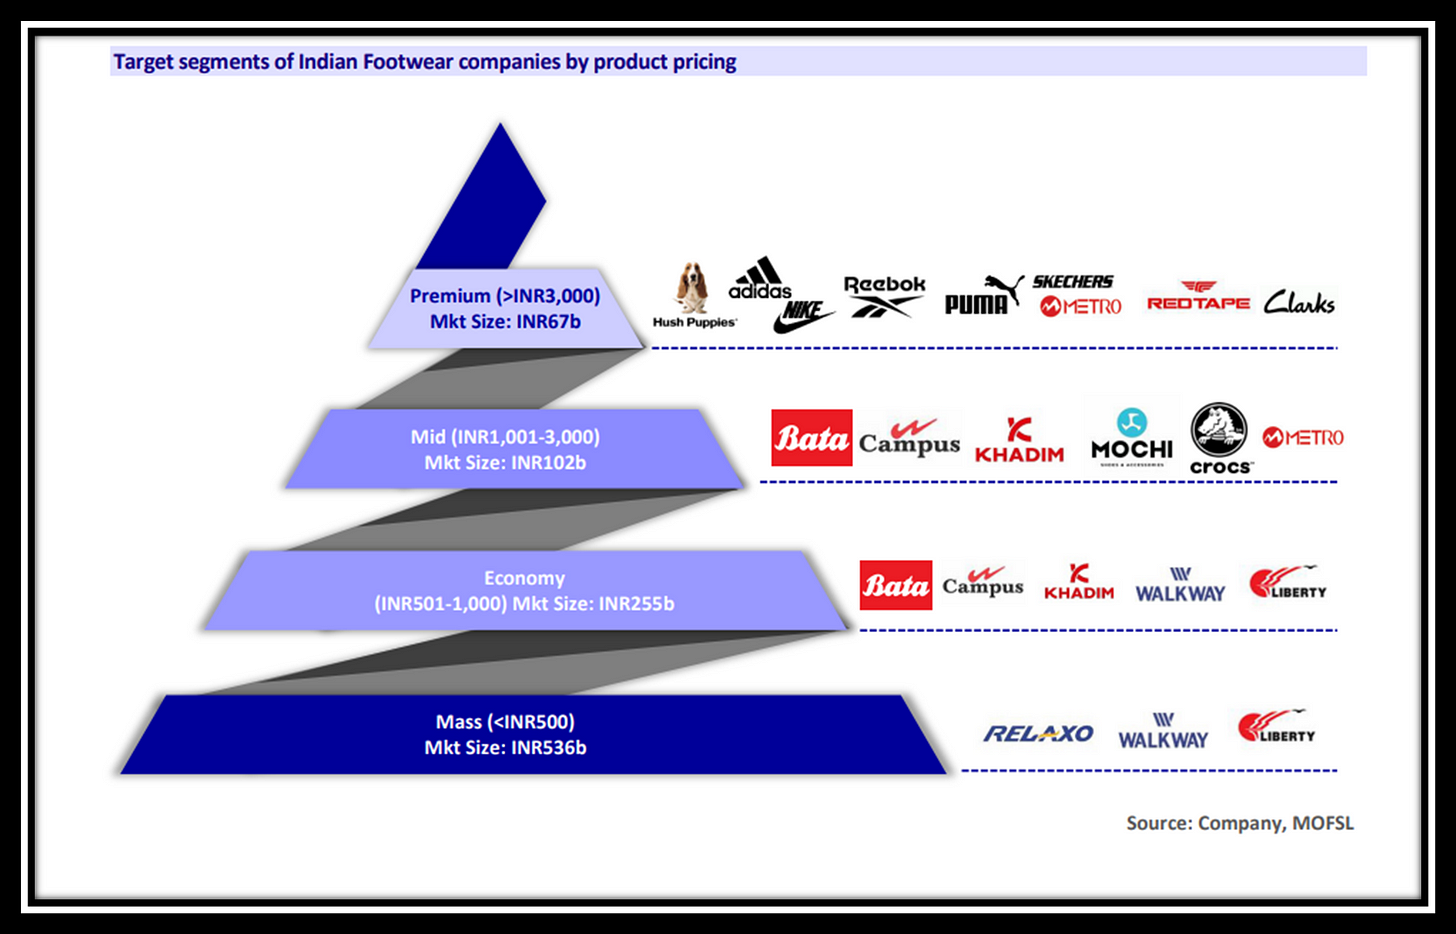
- Premium segment will increase the market share from 47% in FY21 to 49% in FY25.Going forward, the Indian Footwear market is expected to shift in favor of higher ASP segments – Economy, Mid, and Premium price segments. While the Mass segment, which occupies a dominant share, may clock 6-7% CAGR over FY20-25, the higher price point segment is expected to grow at a higher rate (10-11% CAGR).

- Tier 2/3 cities will drive the next leg of growth which will be led by north and south respectively.
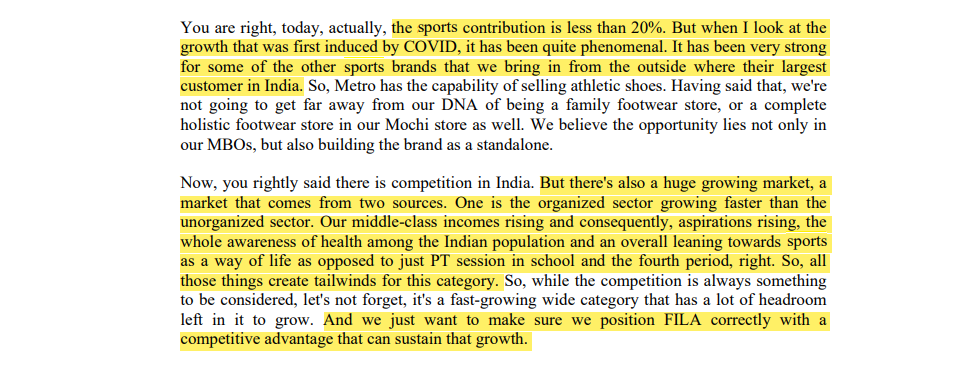
- The Indian S&A market which remains highly under penetrated, is estimated to grow ~16% CAGR over FY20-25 and almost double (USD2.6b in FY20). The ASP of Sports Footwear is 75-150% higher than Casual Footwear.

- E- commerce footwear market is expected to grow at a CAGR of 26-30% till FY25.

Indian consumption story and structural shift
India's share of domestic consumption, measured as private final consumption expenditure, in its GDP was approximately 60.5% in FY 2020. In comparison China's domestic consumption share to GDP in 2020 was 39.24%. The median age in India is estimated to be 28.1 years in 2021. The households with annual earnings between US$ 5,000-10,000 have grown at a CAGR of 10% between FY 2012-2020 and their number is projected to further double by 2025 from 2020 levels. The consumption pattern also has moved towards higher spend on branded products and through organized channels.

You will see whenever the GDP of any country grows in which household consumption has a significant chunk, B2C companies have created a lot of wealth. It has happened in countries like the USA (Nike, Skechers ), and China (Li-ning and Anta). Similarly many retail companies have performed well during this period. Why does this happen?

Answer lies in per capita income. Whenever the per capita income of any country reaches that level where all the basic necessities of humans meet then they tend to fulfill their aspirational needs which they are not able to fulfill due to limited wages/salary. In the USA it happened in the year 1970 and in China it happened during the year 2005 after this inflection year both the country has seen a rapid growth in their GDP and per capita income too. In India it has already started after covid-19 struck or it may start during the period 2022-2025. During this period the trends like premium products, additional benefits In Indian mother language fizul kharchi starts. One thing which will drive this fizul kharchi is the young population as they are the one who will do active shopping every time Just waiting for their pay-check :)
I have done some data crunching from my side to understand why retail stories can replicate in India.

Many of you will say that China has saw decreased in their private consumption as a % of GDP and Yes you’re right but wait let me show you one data which describes that although private consumption as a % of GDP has decreased but Chinese people’s aspirational need for clothing, household facilities has not taken a hit after year 2003 you could refer the below mentioned image to understand this point.

Will China story play out in India
We Indian investors always had a habit of comparing India VS China investment cycle’s like what has happened in the past in China will happen in India as well. Somewhat it's true for footwear, retail and QSR sectors because humans are the same, their needs are the same after a certain point of time. So, will stories like Li-Ning and Anta sports play out in India?
CASE STUDY: Anta groups ( Taking this case study over Li-Ning as it match with metro brands)
Anta’s business adopted a wholesale distribution model in the China market and for more than 20 years this model has been effective in promoting the Anta business through a nationwide coverage that fulfilled different local business cultures and consumer preferences, it is today world’s 3rd largest sportswear company by revenue after Nike and Adidas. Anta has 3 business groups to facilitate multi-brand strategy: Performance Sports Group: Anta, Anta Kids, Sprandi Fashion Sports Group: Fila, Fila Fusion, Fila Kids Outdoor Sports Group: Descente, Kolon Sport.

Anta has focused more on the acquisition path; the company acquired sportswear brand Fila’s China business in 2009. The approach placed Anta as a mass market brand while Fila targeted the high-end sports market. Fila contributed more than 50% of the total revenue in FY 2020. In July 2015, Anta acquired Henan Material, which manufactures shoe soles in the PRC. In 2017, Anta Sports acquired the business of KINGKOW and formed a joint venture company to operate Kolon Sport business in China, Hong Kong, Macao and Taiwan.
Anta is also the strategic partner for the Chinese Olympic committee and has sponsored the winter Olympic games held in Beijing in 2022. Slowly and steady Anta has transformed themselves into apparel players which was reflected in their FY20 revenue also. R&D cost as a % of sales is one of the important metrics which must be tracked in B2C companies on which these two Chinese companies have worked well.

Retail sector breakdown
Footwear sector has 5 common models in which they handle their operations.
1. COCO MODEL- COCO stands for Company Owned and Company Operated, where the brand owns the franchise store unit and operates the business itself. Scaling in this model is a little bit difficult but brand value and customer relationship remain intact. Ex- DMART, Metro Brands.
2. FOFO MODEL- FOFO stands for Franchise owned and Franchise Operated, where the company gives its brand name to the franchise investor for a particular non-refundable sum (franchise fee) and for a pre-agreed time period. The Prices and merchandise for the outlet are decided by the brands. So, the franchise investor is the owner of the store, and all the operational cost has to be borne by the franchise itself. Scale is fast in this model but brand value is in danger. Ex- Vedant Fashion, Bata.
3. Omni channel- Merging of online and offline channels is called Omni channel. Presently metro is focusing on this model too as they provide less or no discount in this model.
4. Multi-brand outlet- It refers to retail stores that are not dedicated to one particular brand but keep various brands from the same category. Ex- Shopper Stop, Reliance Retail.
5. Exclusive-brand outlet- An exclusive-brand outlet refers to the format where the store is dedicated to one brand and exclusively shelves the products from the brand. Ex- Jockey, H&M.
2. Why do I like Metro Brands over other companies?
SHORT HISTORY:
After talking about a lot of history, macros, US-China and data crunching, let's focus on Metro Brand, only first starting with a short past history. In 1955 the first ‘Metro’ store was set up in Colaba, Mumbai to become a nationwide chain of exclusive fashion footwear and accessories stores for the entire family. In 2000 MBL opened their first mochi brand MBO. I will use MBL as a short form of metro brand please don’t get confused between these two terms. Within 10 years of opening their first brand MBO they had reached 200 stores across India. In 2015 MBL tied up with Crocs for their exclusive right for crocs sale in India. Fast-forward in 2021 they had tied up with fitflop brand which deals with women casual wear. So MBL has a history of scaling their business operation through international brand tie-ups.

BUSINESS OVERVIEW:
In the Indian footwear sector every company is following a different strategy, a kind of monopolistic market where large players exist whose products are the same but still some difference exists between them. Relaxo and Campus follow the distribution model where metro and Bata follow the retail model in which investment and working capital are high but the brand creation and high gross margin favors them which has reflected in their return ratios too.

Metro follows a 75:25 ratio in which they try to keep 75% of their own brand sales and 25% of third party sales. Some of their own brands consist of metro, mochi, walkway , princess etc whereas third party brands consist of crocs, fitflop, clarks etc.

Generally third party brands have higher ASP as they are premium products and cost to MRP factors also play out into this. The online channel, which contributed 7.5% to total sales in FY21 improved to 8.4% in FY22. Going forward, 25-30% business should accrue from the omni channel, which saw growth double in the last couple of years.
MBL follows a Theory of constraints: The company adopts a disciplined Inventory replenishment system on a pull-based model to avoid excess inventory as per its store demands and requirements. The business is managed bottoms up, with the manager providing feedback on the merchandise to the buying team. Based on this feedback, it decides its products and merchandise.
MBL also follows a loyalty programme in which they provide loyalty points to customers and in exchange for the next purchase they provide some sort of discount on net bill value. METRO’s customer loyalty programs – Club Metro, My Mochi, and Crocs Club has more than 5.8m, 4.1m, and 0.9m members, respectively. In recent years, it has witnessed a high proportion of repeat sales from loyalty programs, with their share increasing to 54% from 45% of its total store product sales between FY19 and FY22.

Manufacturing, outsourcing and vendor’s engagement:
In footwear where many follow in-house production tracking these three factors become equally important as any disturbance in these three can erode your gross margins. MBL follow asset light model they generally outsource their manufacturing operations. They have a joint venture with M.V. Shoe Care Private Limited which is engaged in the manufacturing and sale of shoe care and foot care products under its own brand. About 85%-90% products are sourced from India while remaining they import from countries like China, Thailand and Brazil to meet seasonal demand and minimize their cost which is also highlighted in their gross margin which is industry best in the range of 55-57%. In the last three years they worked with 250 vendors out of which top 50 vendors contribute 77% of in-house production. MBL receives raw materials at their raw material warehouse in Bhiwandi, Maharashtra.
Products, geographies and store footprints:
Among their 5 main brands are mochi, walkway, metro, crocs and fitflop . Crocs average selling price is Rs1800 and crocs store take 600 sq feet which is a good in terms of revenue sq feet also. Crocs sales per sq feet is 29,403 which is higher in comparison to other brands, Walkway has lowest sales per sq feet among all the brands as walkway caters to low segment customers.

Most of their crocs stores are open before the monsoon season to take advantage of the rainy season.

Fitflop and crocs has an exclusively brand outlet (EBO), whereas metro which caters family and mochi which caters youth and walkway which caters to value brand customers are having MBO’s only. Most of their future growth will come from premium products and for it they had tie-up with fitflop which caters to women casual wear mainly working women’s. You can check out this informative video.
By FY25 MBL has planned to open 260 stores (Target given during IPO) which does not include Fitflop stores. MBL management is not adding brand just for sake they had highlighted this in their last concall which is a good trait.

Crocs has shown a good growth after its agreement with MBL and from 2019-2022 number of EBO’S of crocs has shown a growth of 23% CAGR whereas crocs sales grew by 30% from FY17-FY21.

Presently they had decided to open 5 stores of fitflop only but considering that if they get a good response they may open more stores in future. First store which was opened in express avenue mall Chennai has shown a good traction as of now indicated by management and they are promoting their newly open store through fashion influencers on instagram. Fitflop price range is between 5000-10000 and ASP is above 5000 but store requirement is only between 400-500 sq feet good for store unit economics. On the cost front, little costly as per me but not by MBL they had highlighted this in Q2FY23 concall.

Considering that they are targeting 260 more stores by FY25. Let see the store capex across the brands (Almost all the stores will be funded by IPO proceeds and MBL has healthy operating cash flow which will provide cushion to them).

Metro and mochi stores require high capex as they are generally present in Tier 1/2 cities and cater to the family and youth segment. Walkway security deposit is low in all of them due to higher presence in tier 2/3 cities.
RECENT TIE-UP
METRO has recently made a tie up with ECCO's footwear for retail expansion in India. ECCO Denmark-based brand that manufactures and retails premium leather shoes and accessories across 101 countries. Metro Brands will retail ECCO’s formal collection for both men and women in strategically selected Metro and Mochi stores located across India. ECCO footwear will also be accessible to consumers in India through the Metro and Mochi websites. Some details which I gathered about ECCO'S from Myntra website Price range - 5000-15000 so it will be a higher ASP third party brand will Target a premium segment categories - Casual, sports, formal shoes, heels, boots, flats will cater to both women's and men's.

MBL has PAN India presence and its high weightage is south zone followed by north and west zone. East zone contribution is less but after my fact check on their instagram page MBL is making a presence in east zone particularly in West Bengal. Approx 50-55% of MBL stores are in the high street area. MBL first try to gain traction of stores by tracking its performance for at least three years after which they decided whether to continue it or not either they closed down the store or relocated it. Every store that MBL opens has some sort of growth period after which the growth starts declining. The same is highlighted in the Q1FY23 concall.

That’s all for store footprint and geographies I believe that MBL is old and successful company with experienced management so they will target the geographies which has less penetration in terms of ASP and premiumization without wasting our time on this we should move to next part which is store/unit economics of store located in tier1/2/3 cities.
Store/Unit Economics of Metro Brand
Unit economics refers to the direct revenues and costs of a particular business measured on a per unit basis, where a unit can be any quantifiable item that brings value to the business. In simple terms unit economics helps to know the break-even point of any business. You can calculate the unit economics by tracking the payback period which is equal to initial investment/ EBITDA. A healthy unit economics will help you to gauge the ROCE/ROE which tends to re-rating of any stock.
METRO’s overall business economics is dominated by a healthy gross margin, lesser retailing costs, and lower store investments (capex and working capital). I had taken payback period data from one brokerage report which is trustful.
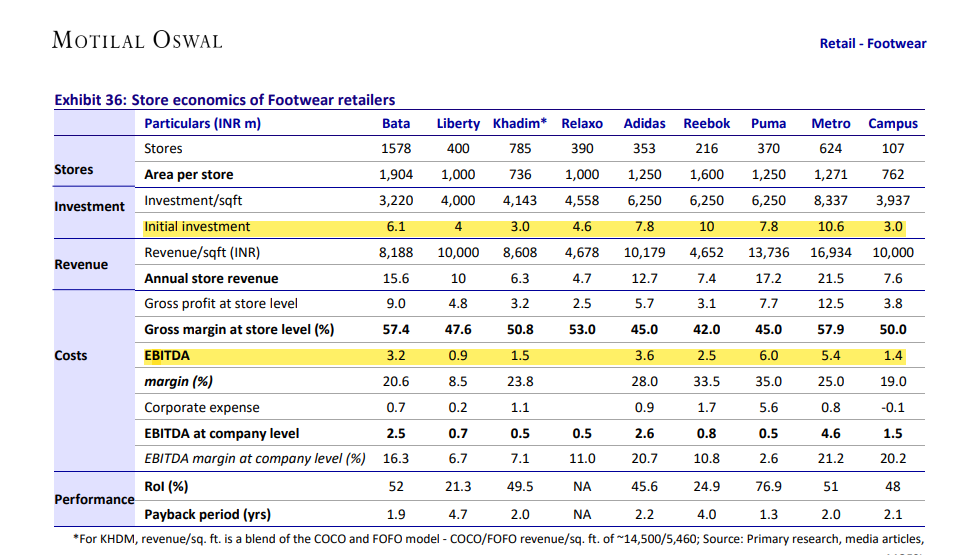
Puma has the best payback period in all of them only because of their EBITDA but at company level, their EBITDA it’s low among all of them. Coming to MBL, its payback period is more or less similar to BATA and Campus. MBL has the highest investment/sq feet but still their revenue/sq feet is highest among all of them due to higher contribution of premium products > 3000 price products. It reflects in their payback period of 2 years which is more or less equal to other listed entities. In future we may see an improvement from here as the company is targeting to open more stores in tier 2/3 cities where unit economics is more favorable. Snippet from Q1FY23 concall.
When we move to tier two, three towns, obviously as you know rentals and all other expenses are significantly lower when compared to say Metro cities. So just to give you an example in Metro city, a store doing 40 lakhs sales per month may generate 10% PAT, whereas a store in tier two or three, generating say INR 15 lakhs, INR 20 lakhs, sales per store per month may generate higher PAT. we will grow much faster in tier two, three towns as compared to say Metro cities, where we penetrated slightly earlier than them.
If they start penetrating the tier 2/3 cities with their higher ASP products which includes fitflop, crocs, FILA through their recent acquisition ( I will talk on this latter in this blog) their store economics will remain intact and creating ROCE on a large base will help them in future to become consistent compounder as long as they remain market leader in their segments.

Though this chart is not an apple to apple comparison, still we can see the unit economics of QSR and Footwear where average payback period of listed companies is 6-7 years and footwear companies have average payback period of 2-3 years. Royalty as % of sales is QSR space due to franchise and international brands for KFC,Burger King, and Mcdonald’s.
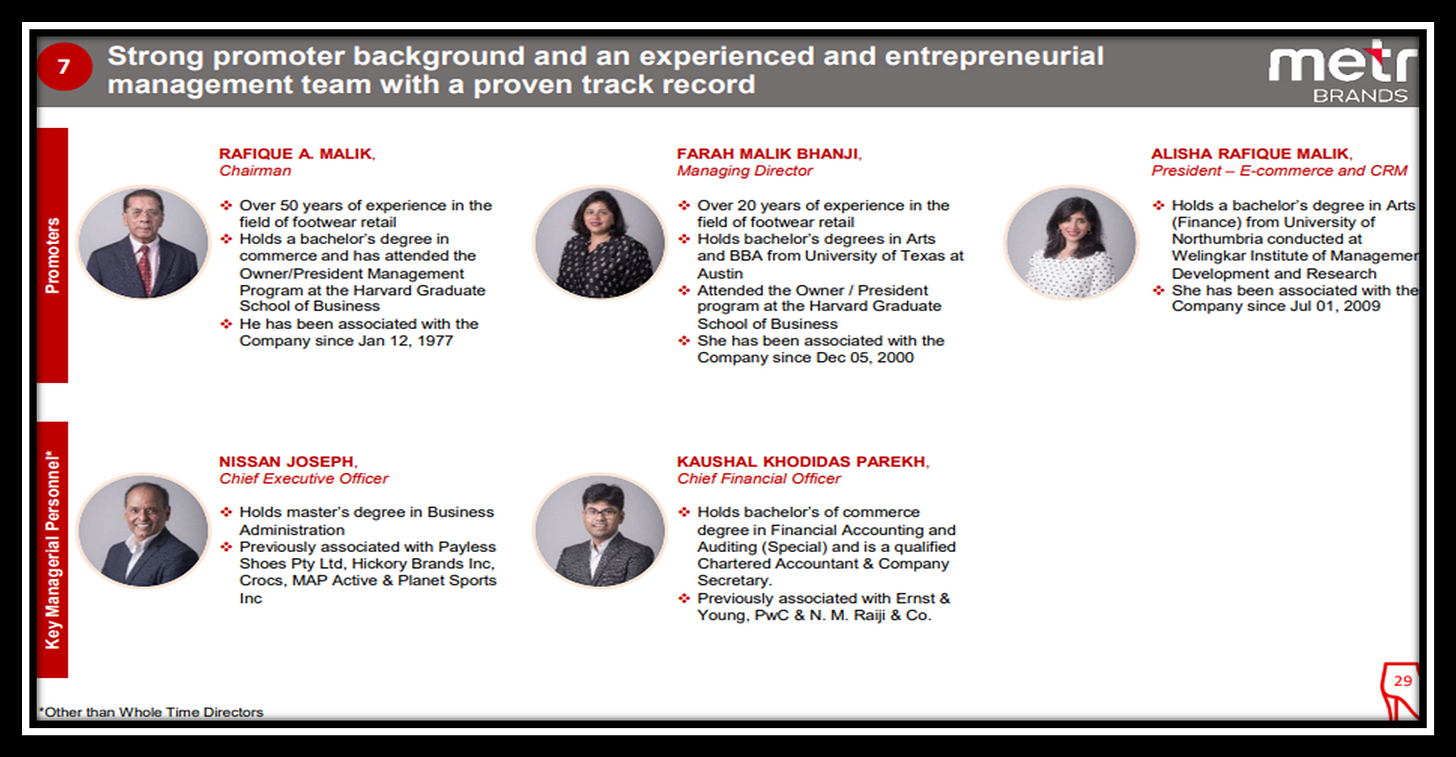
Management
MBL has some experienced management with one marquee investor on their board also. Mr. Utpal sheth you may know him if not then please check out this video after this blog you will never be disappointed :)
Without going into deep of management I am just attaching one chart which covers all the information about the promoter of the MBL. In unlisted space they have already proved themselves so I have faith in MBL promoters that they will continue their streak in listed space also. In investing 80%-90% bet is on the promoter of the company. But if you want to know how to judge management of any company then read Mr. Samit Vartak newsletter, I am attaching the link at the end of this blog.
3. Why should you look into Add-Spend and brand ambassadors?
I had read many reports on consumer retail companies in which many brokerage houses had covered the followers of their company on social media( Instagram, Facebook and Twitter) but as per me we should look into the followers of their brand ambassador. Why? Simple rational: anyone who wants to buy a product of any brand will get influenced by influencers or celebrities, he/she will not go and visit the social media platform of the company. Even though many of us want to buy the product which is worn by any famous celebrity or anyone, every day we scroll down the stories and posts of our celebrity, not any company social media handle. I have done some rough calculations of different footwear companies in which both metro and relaxo has good numbers according to my calculation.

But you will ask why I am looking towards brand ambassadors. What does it tell about the company? Brand ambassadors play a very important role in brand creation and company sales too. Relaxo is a very great example of how they created their brand in the niche lower end segment by onboarding bollywood celebrities Salman khan and Akshay kumar. You can check out the professor Sanjay Bakshi's relaxo lecture. You will understand the power of brand ambassadors and why you should track advertisement and sales promotion expenses and compare it with their peers.
Campus ad spend is increasing YOY but for relaxo and bata it had remained constant in last 5 years, MLB spend decreased in 2021 due covid ad and marketing spend has halted but as they move further there sales promotion is going to increase every year. Which they indicated in their latest Q2FY23 concall.

They are making tie up with international brand and in order to increase their brand reach they need to onboard any famous celebrity or increase their reach by the help of fashion influencers and we know fashion influencers can easily reach to customers through instagram or youtube channel and charge less fees in comparison to bollywood or sports personality. You can check crocs India instagram page to get to know their brand promotion through bollywood celebrities and fashion influencers.

We all know the reach of the celebrity which are mentioned in the above image, still I am not sure whether this sales expense will come in MBL or it will come in Crocs India pvt ltd as this advertisement is on Crocs India instagram. If you know then please let me know. Recently launched song Kesariya in which Alia bhatt has worn one boots in the shooting of this song is of metro brand only (though not 100% sure) and the shoes which was worn by made in India song of raja kumari famous american rapper is also of metro brand. So, slowly and steadily they are entering into the movie and song sphere.
4. MBL VS PEERS
In the footwear sector you can’t compare and justify the valuation of any company as all of them are following different strategies. Relaxo has lower ASP SKUs whereas MBL and Campus has higher AP SKU’s. Relaxo cost of retailing is highest as they also follow distribution model whereas unit economics of MBL is best in industry, campus ad spend as a % of sales is growing YoY. So, we can’t compare any metric against any company and take our investment decision but still we can see some basic metric which will help us to know which player is doing good in which segment and which segment is growing.
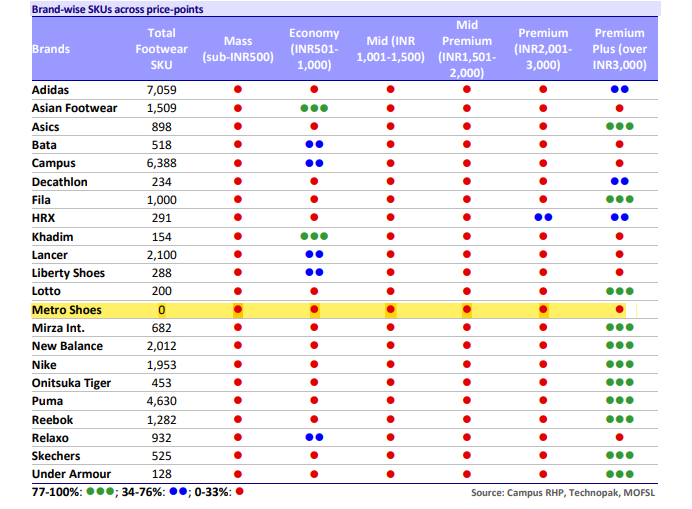
In this chart we could see that MBL has the most balanced SKU’s portfolio, whereas some sports brands have a large proportion of SKUs in the premium segment and some are focusing only on the economy segment. In this chart total SKUs of MBL is missing which is 1419. Maybe in the future more players will come in the premium segment due to the fastest growing segment.
Relaxo plays a volume game where volumes are higher but ASP is lower, whereas MBL plays an ASP game where ASP are higher and volume is less. Due to increasing competition relaxo is facing inflation impact with more players coming in the mass segment, clearly they are failing because of their no to premium segment. Relaxo is facing competition in their mass segment due to new GST rules and entry of new players. Their chairman letter has also highlighted this in their press release of Q2FY23.

In terms of store the MBL has 1/3 more stores than the bata and in the same way campus has 1/6 more stores than campus as per FY22 data. Relaxo has no data available as they focused on the distribution model, but in Q2FY23 concall they had highlighted on opening more EBO’s. In average store size MBL stores remain in line of 1000-1200 in the last 4 years versus bata has average store size of 1500-1700 which is too decreasing after FY20. But as we move forward MBL average store size may reduce in future.

We can’t compare relaxo and MBL and justify their valuation that if one stock is trading at PE of more than 50-60 for a long time then the second stock should deserve an in line valuation. If we want to compare MBL then we should look into those companies which are focusing on the premium segment. In listed space bata and campus are two of them though both of them are not pure premium focused products but slowly they are moving towards it. For 9MFY23 Bata revenue contribution from product > Rs1500 is 40 % which is 33% in FY22.
Another listed company campus whose semi-premium segment is growing fast, some of their products are mind boggling, their mens shoes for price above 1500 has a really eye-catching design. The premium contribution in FY19 is 31% which grows to 41% in FY22, whereas their products below 1050 have fallen to 35% from 47%. This premiumization has resulted in their ASP growth of 7.8% CAGR in the last 4-5 years.

MBL sales contribution for products > Rs1500 is 86% in Q2FY23 out of which 43% is for product > Rs 3000 so, somewhat MBL has no peer which is close to this that’s why MBL deserves the scarcity premium which relaxo has enjoyed in the past.
5. Cravatex acquisition
In Q2FY23 MBL has informed that they had acquired Cravatex for Rs 202 Crore and in FY22 Cravatex had done a sale of Rs 156 Crore but had a debt of 163 Crore but still we have to see the growth part loan will be pay off as MBL has healthy operating cash flow. After this acquisition MBL will receive exclusive rights for Proline and for the sale and distribution rights of FILA across formats, including Exclusive Brand Stores, Multi Brand Stores, Airport Stores, Distribution, Online Marketplaces and Web stores, in India. The deal is for the whole brand that comes under Cravatex which includes Vans, matrix, johnson, horizon, stage and ziva.
Some snippets on Cravatex acquisition from Q2FY23 Concall:
- Fila is under penetrated by high opportunities in athleisure. Fila had extended local license with Cravatex for 30 years.
- FILA Average selling price probably in around 3000-5000. FILA is more like a hanging fruit type opportunity.
- FILA have net 20-30 EBO's (Franchise) but MBL wants to rationalize them into the COCO Model.
- Cravatex acquisition is for all brands but now they have decided for FILA and Proline operation.
- Licensing fees for FILA is market competitive.
FILA has a very interesting story if you want to know more then check this link FILA HISTORY
Cravatex management has not walked the talk in the past and after MBL takeover FILA is well positioned to take advantage of the growing S&A market. With acquisition MBL also got the right for the apparel segment in which they are not combining their operation but still arranging a team for it. In Q2FY23 management also highlighted that the apparel market is growing faster than the footwear market.

6. Can they replicate their past growth (Accelerator pitch)?
- Growing its presence in the e-commerce market where they provide no discount and maximum products are sold at full price. In Q2FY23 MBL achieved the highest ever E-commerce sales of INR41 Crores, which was up by 21% on a y-on-y basis. Going forward 25-30% business should accrue from the omni channel,
- METRO entered into a long-term exclusive agreement with FitFlop in Jan '22. With this agreement, METRO gained exclusive rights for sale and distribution across all formats, including EBO, MBO, distribution, and digital mediums in India. Catering to the fast growing Wellness category, it provides a range of flip flops and footwear in the Premium segment, which could be the next driver of growth.
- MBL has only 672 stores (Q2FY23) against bata which has 1600+ stores which provides a huge growth opportunity, in addition they have a target of adding 260 from IPO proceeds which doesn’t include FILA stores they have hinted this in Q2FY23 concall.

- Cravatex acquisition has provided MBL a good opportunity to tap into the S & A market. Growing aspirational needs, rising income, young population and sports as a career provides good opportunity to grow in this segment.
- More tie up with third party premium brands which have a higher ASP will help MBL to improve their unit economics and play the premium game which is one of the fastest growing segments in the footwear sector. In Q1FY23 they have also highlighted this aspect.

7. Financials and Valuation

- MBL has sound financials and their strong operating cash flow will cater to their store expansion.
- Although sales have remained flat between FY19-FY21 but have shown a decent growth in FY22 with improvement in their margin profile too.
- The CFO/EBITDA conversion rate is also above 50% which is good enough in B2C. MBL has no long term borrowing whatever is shown in borrowing is lease liabilities due to Ind-AS 116 policy.
- MBL has a healthy operating cycle, store-level inventory turns stood at 3.2x, with INR6-7m of inventory and a revenue/store of over INR21.5m.
- In this Q2FY23 quarter MBL performance is good considering that its a seasonally weak quarter and they are able to maintain their gross margin in this environment.
Now coming to the valuation part, I will not do any excel work or reverse DCF projection like I did in my earlier blogs. So, In the retail sector where promoter holding is very high, low free float plus earning trigger presented in the company, what we have generally seen is that they always trade at premium on some rare cases they fall below their mean valuation metric and that’s the time we have to back up our trucks. I have done some excel work to understand how free float and elevated valuation can still make returns.

The above chart demonstrates how a high promoter holding and good earnings growth with elevated valuation can still make returns in this market. For comparison I have three consumption driven stocks DMART, Berger and Relaxo all three of them had shown a decent EPS growth with stock return more than the EPS growth rate in the last 5 years. In case of MBL it has all the above mentioned features and good growth triggers too can justify these valuation in future. In valuing MBL we have to create our own variant perception different from market POV, for which I have done one more excel work.

All 4 stocks which I have mentioned in this chart are well known to the market from the last 5-10 years but still they have provided decent returns. So, it doesn’t matter how large is the base or how much growth is priced in what we have to see for how long these companies can beat the street estimates then only returns can be made remember for these type of stocks where market already with its modeling valuing stocks on forward PE basis but return can be made when consensus estimate < your own estimate. (Your growth estimate should beat the consensus estimate). But yes you have to time your entry according to your margin of safety because high valuation brings high responsibility. With this our valuation part has come to end.
8. Key risks
- Unlike a fleet of different in-house brands in Formal and Casual categories, Metro has only one brand in the fast-growing Sportswear category and sales is skewed towards third-party brands. This poses a risk in the long term to customer retention.
- If MBL is not able to turnaround the FILA business then it will not be able to grow its presence in the S & A market and may be a huge setback for MBL.
- In the past few years, several foreign brands have grown significantly, particularly in the fast-growing Premium Sports category, thus offering stiff competition to Metro.
- MBL wanted to expand its market share in tier 2/3 cities where consumers are price conscious and may be MBL not able to compete with its competitors.
- Footwear is one of the inflation impacted seasons. If prices of raw material remain at an elevated level then MBL may not be able to maintain their gross margin for which they are known in industry.
- MBL has made an agreement with third party brands like Crocs, fitflop termination in any of the agreements can cause havoc for MBL.
- MBL has a COCO model where the losses of inventory are borne by the company itself. Moreover MBL sells a maximum of their products at MRP with little or no discount.
- MBL has also decided to take its presence through e-commerce where competition is generally high. Most of the online players prefer to keep their product price lower than its peers for which MBL margin can deteriorate if they go for the same.
Thank You for reading the whole blog :)
Disclosure: Nothing in this blog should be construed as investment advice. Please consult your financial advisor.
very nice post. keep it up